PERIGON
See where every cycle loses tons per hour
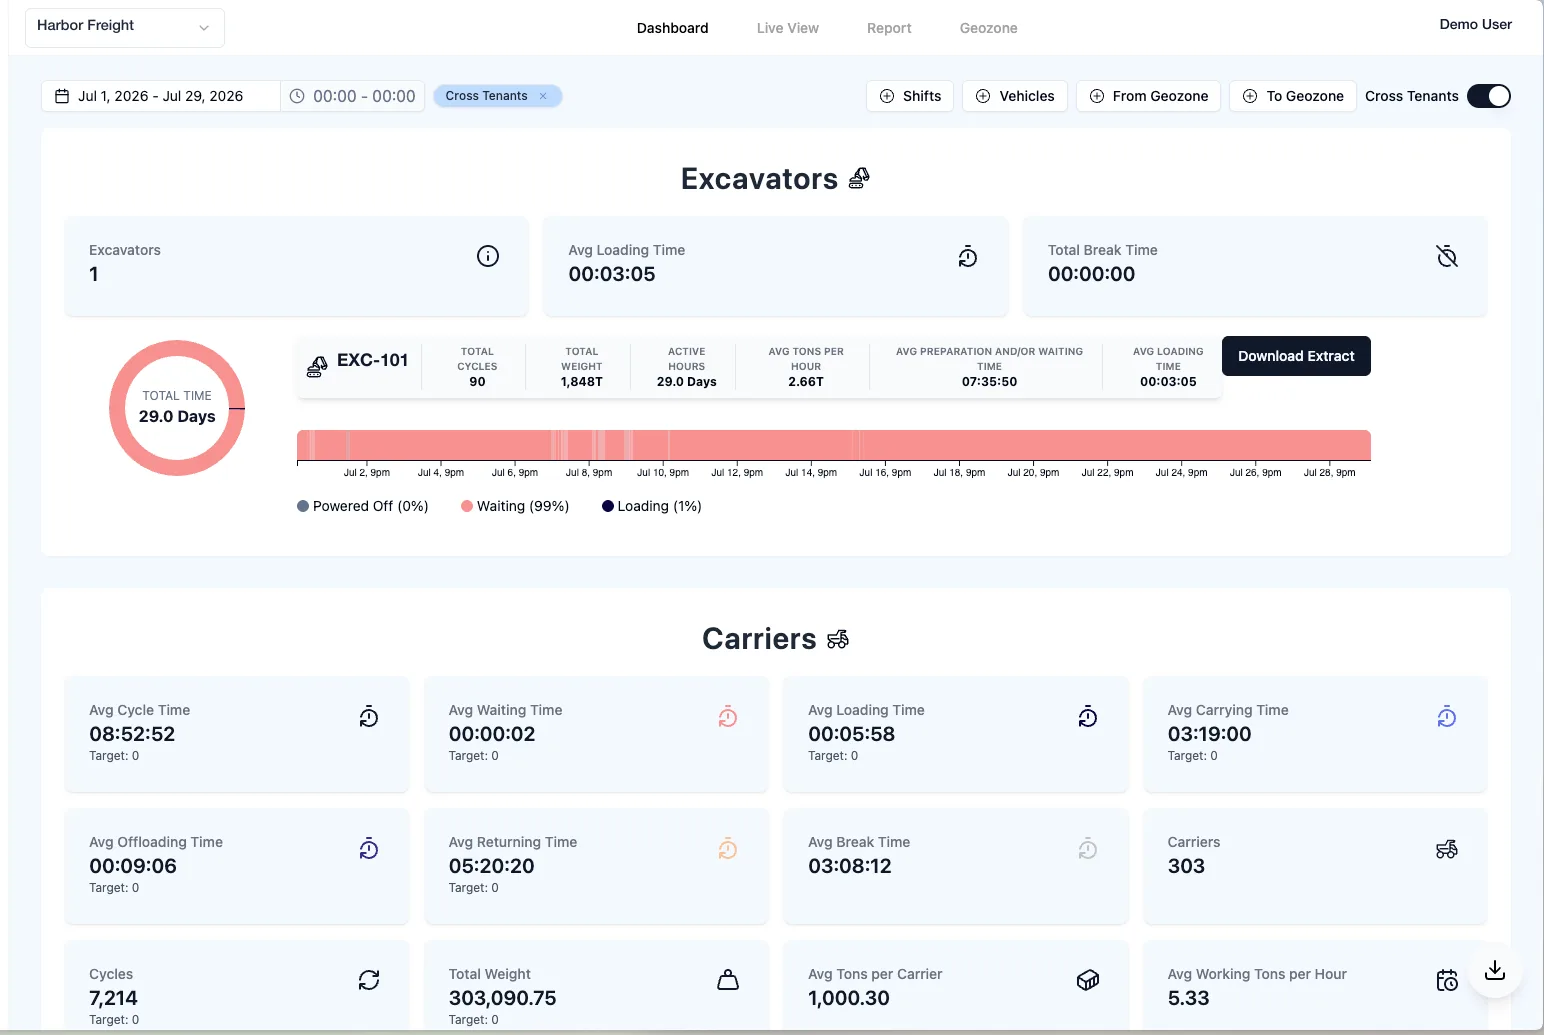
Perigon breaks every production cycle into loading, hauling, offloading, and waiting, using the weight and position data your Kimax sensors already stream. Watch cycles live, compare shifts, and find the bottleneck before it costs you tonnage.
- Excavators and carriers on one dashboard
- Built on live weight and position data
- Shift and geo-zone reports on demand
The Benefits of Perigon
Cycle analytics built on live weight and position data, from pit to pile.
Live cycle data
Loading, hauling, offloading, and waiting times update while the shift is running. You see a bottleneck as it forms, not in tomorrow's report.
Shorter cycles
Cycle analytics show where the minutes go: trucks queuing at the excavator, slow haul segments, long offload turnarounds. Fix the worst stage first and measure the effect the same day.
More tons per shift
When waiting time drops, the same fleet moves more material. Perigon tracks tons per hour for every excavator and carrier, so you can raise throughput without adding vehicles.
Lower cost per ton
Shorter cycles burn less fuel and fewer equipment hours for the same tonnage. Cycle times and tonnage sit side by side on the dashboard, so savings show up in the numbers.
How Perigon works
Sensors on your vehicles and excavators stream weight, position, and proximity data to the cloud. Perigon turns that stream into cycle analytics you can open in a browser or pull through the API.
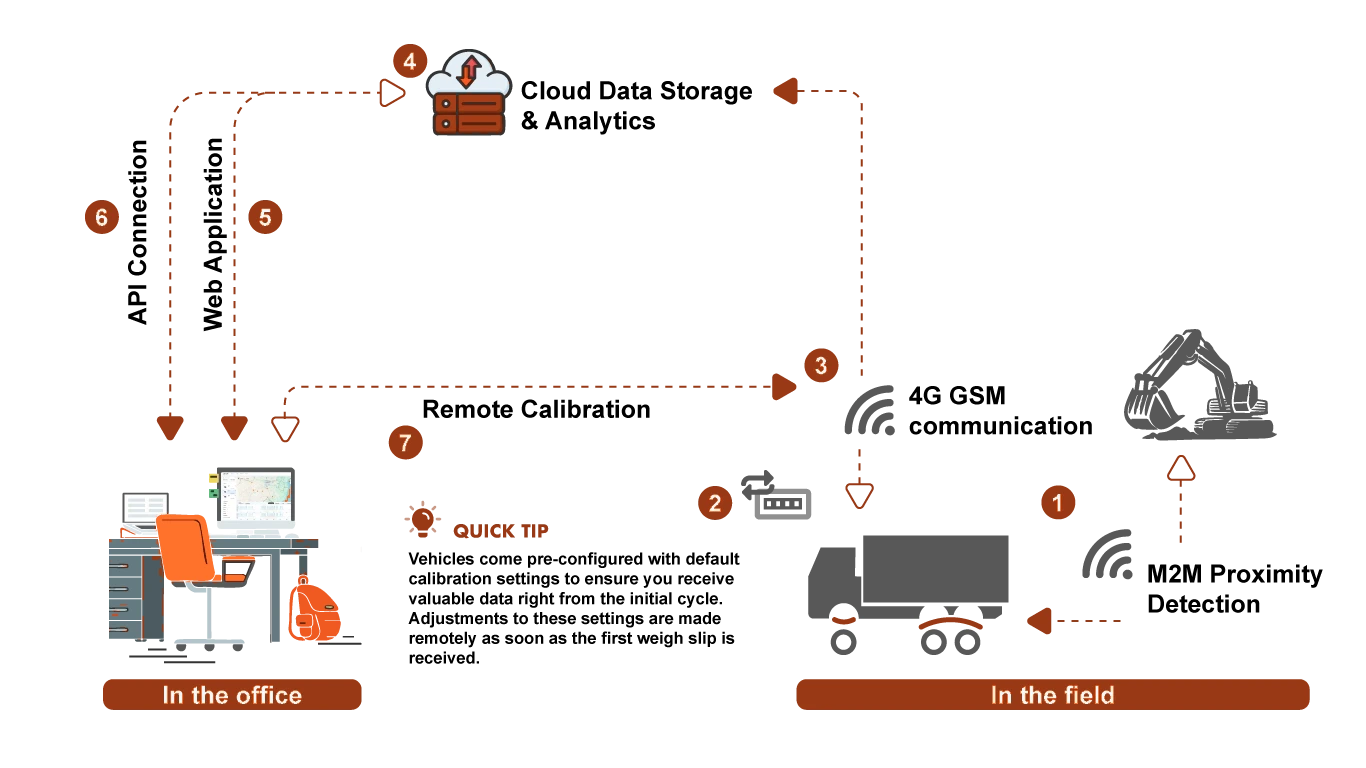

Vehicles and excavators are equipped with Kimax weight measurement, telematics and proximity sensors.
Vehicles can be fitted with an in-cab display and/or CAN bus integration.
Weight, telematics and proximity data is uploaded to the cloud every 10 seconds for precise cycle analytics from pit to pile.
In-cloud data storage and analytics.
An easy-to-use web application gives end users access to real-time analytics and reporting.
API connection to your existing systems.
Remote calibration, no workshop visits.
Feature set
-
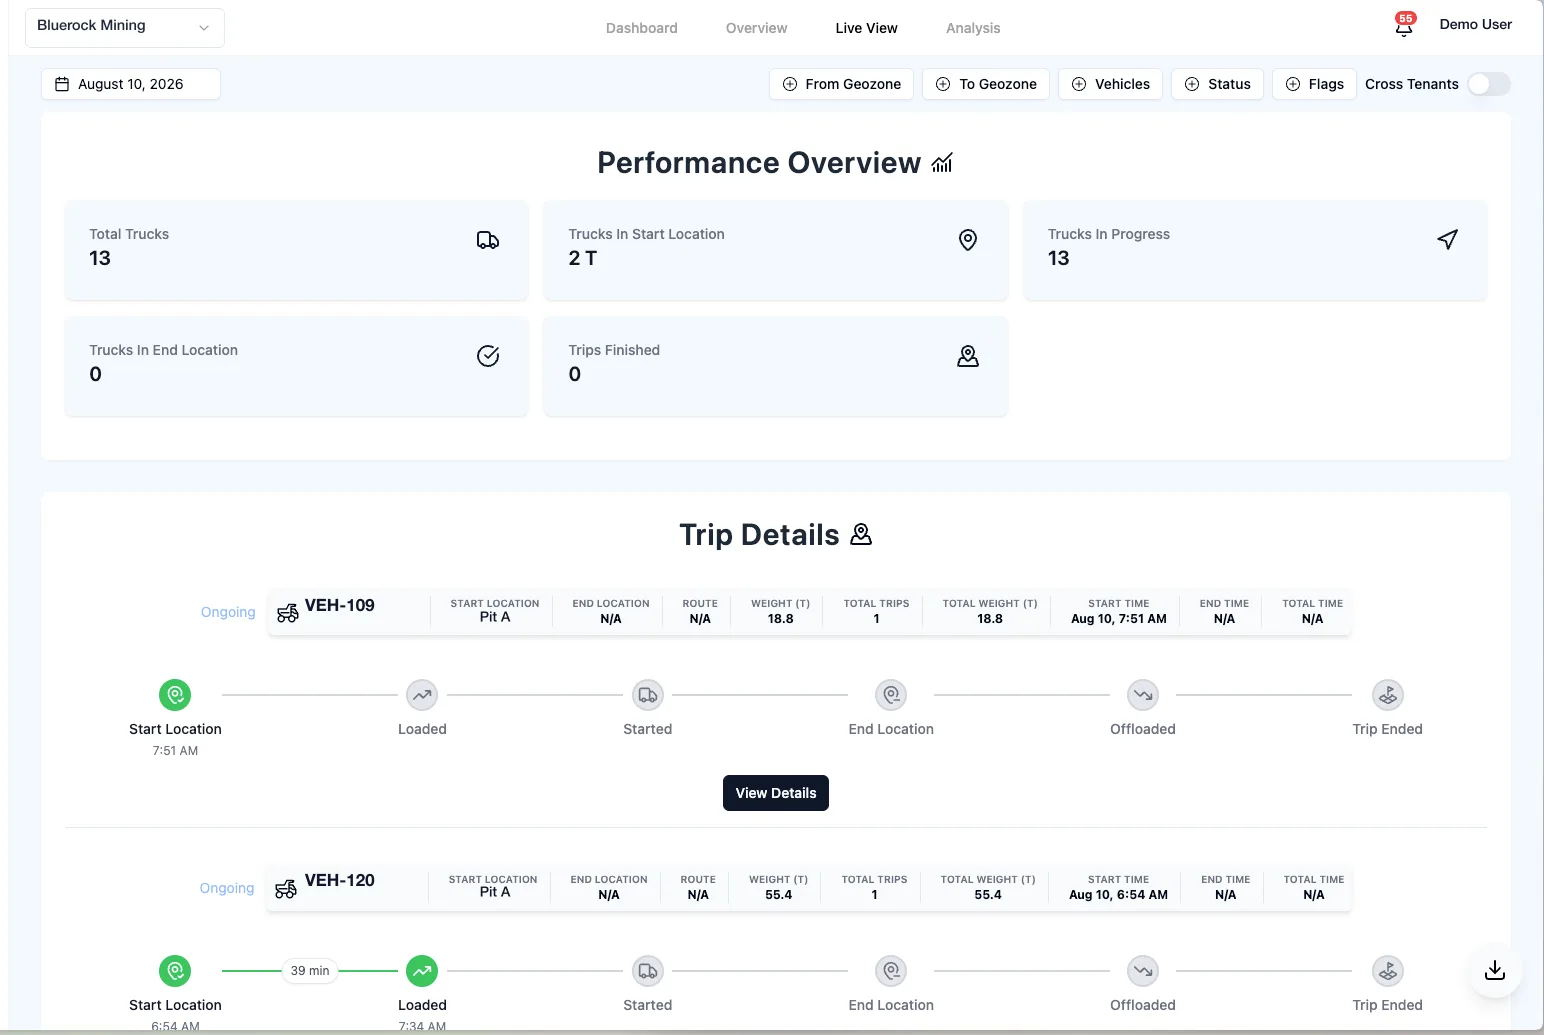
Watch cycles live
See how long trucks wait to load, how long hauls take, and where idle time costs you tons per hour. Act on bottlenecks before they hit throughput.
-
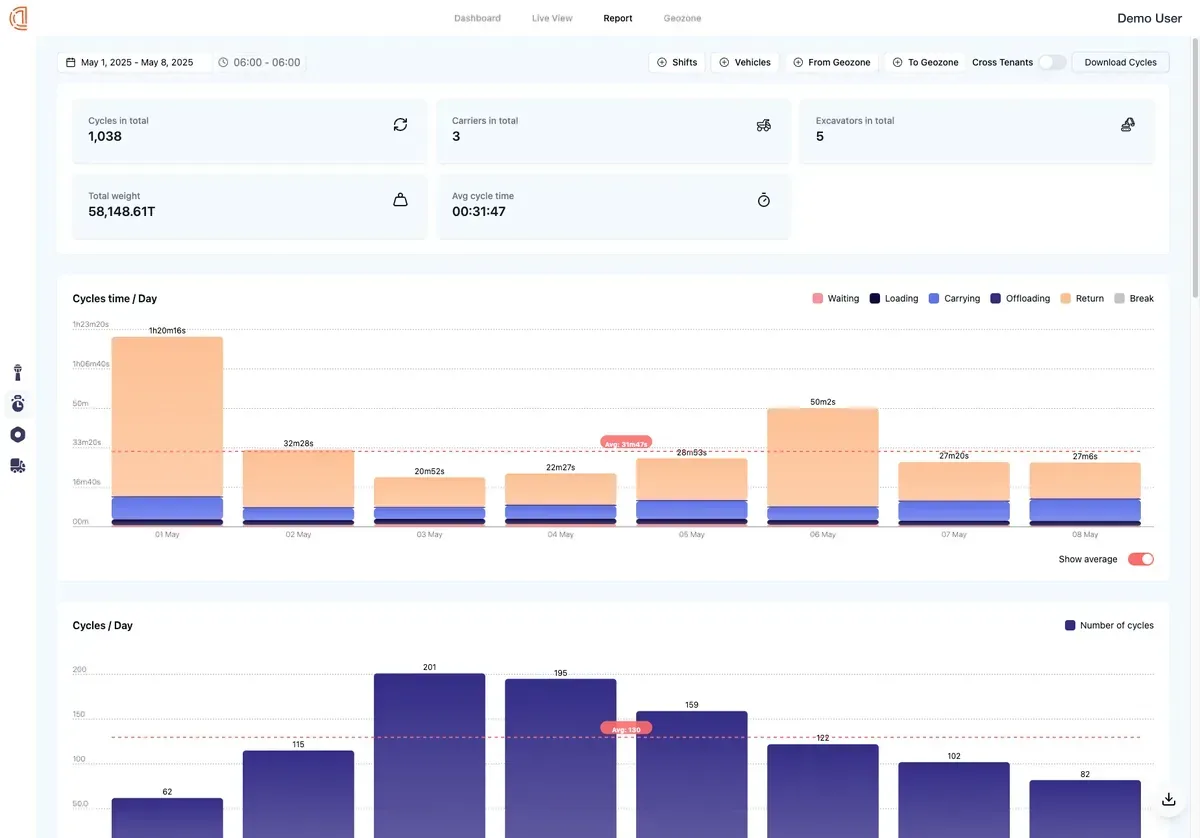
Drill into any cycle
Open cycle-level data to see every stage of every trip. Compare shift performance, track trends, and pinpoint where time and tonnage are lost.
-
Shift-based production reporting
Generate shift reports on demand: tonnage, cycle times, and vehicle utilization, filtered by the shifts you configure and exportable for sharing.
-
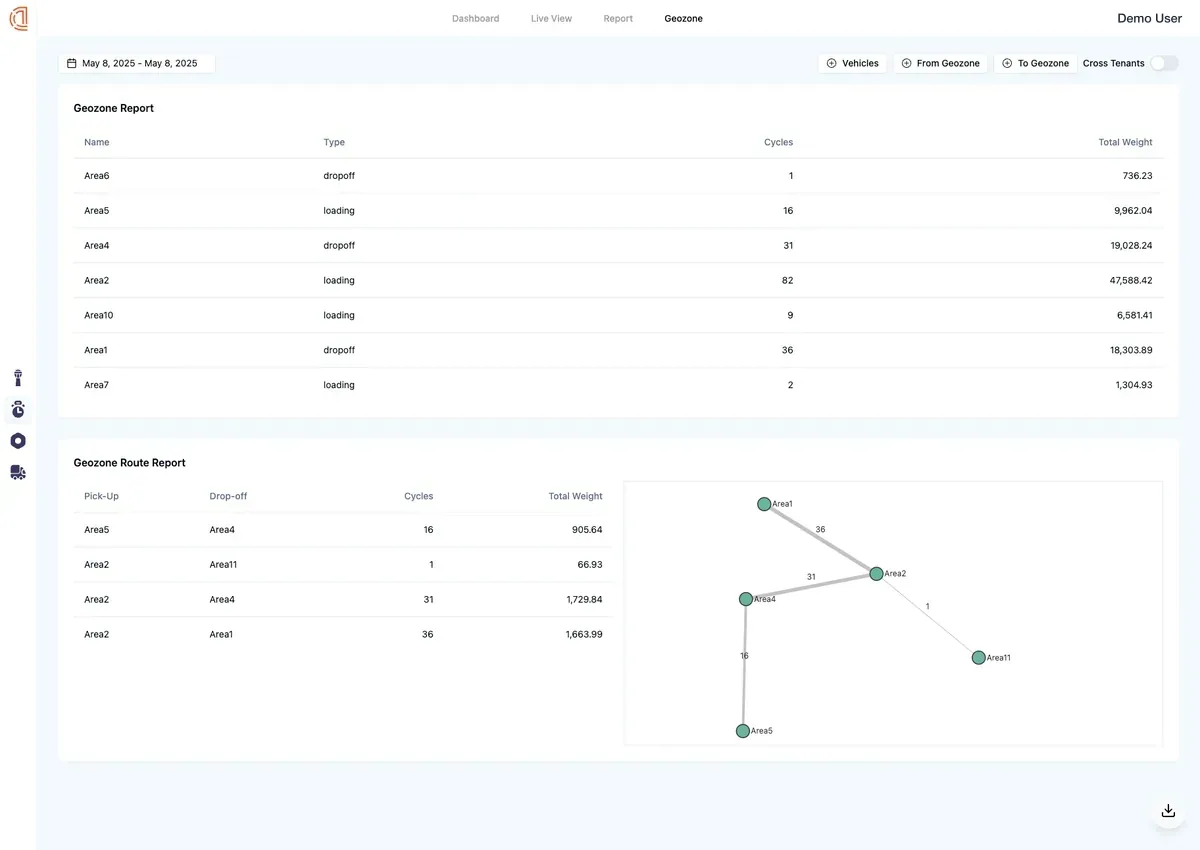
Geo-zone tonnage and performance reports
Break down production data by geographic zone. See how much material moves through each area and where your fleet spends the most time.